| Posted: 24 Jul 2014 09:31 AM PDT
The new home sales report for June – combined with the downward revisions for previous months – was very weak.
The Census Bureau reported that new home sales this year, through June, were 225,000, Not seasonally adjusted (NSA). That is down 4.3% from 235,000 during the first half of 2013 (NSA). Maybe sales will move sideways for a little longer, but remember early 2013 was a difficult comparison period. Annual sales in 2013 were up 16.3% from 2012, but sales in the first four months of 2013 were up 26% from the same period in 2012!
Click on graph for larger image.
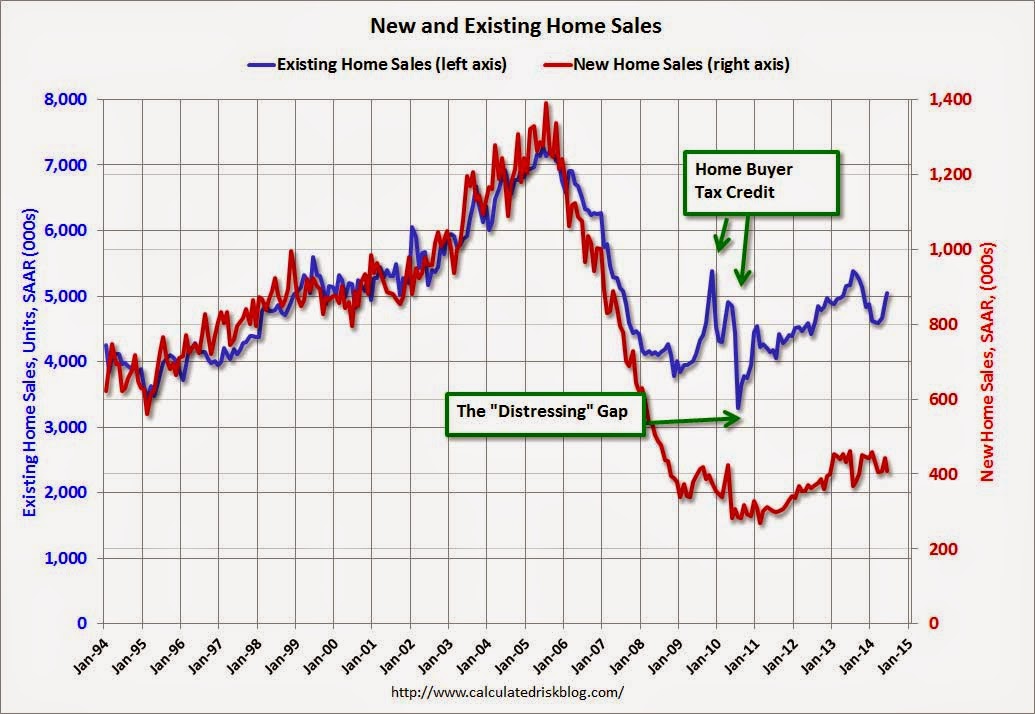
This graph shows new home sales for 2013 and 2014 by month (Seasonally Adjusted Annual Rate). The comparisons to last year will be a little easier in Q3, and I still expect to see year-over-year growth later this year. And here is another update to the “distressing gap” graph that I first started posting several years ago to show the emerging gap caused by distressed sales. Now I’m looking for the gap to close over the next few years.
The “distressing gap” graph shows existing home sales (left axis) and new home sales (right axis) through June 2014. This graph starts in 1994, but the relationship has been fairly steady back to the ’60s.
Following the housing bubble and bust, the “distressing gap” appeared mostly because of distressed sales. I expect existing home sales to decline or move sideways (distressed sales will slowly decline and be partially offset by more conventional / equity sales). And I expect this gap to slowly close, mostly from an increase in new home sales. Note: Existing home sales are counted when transactions are closed, and new home sales are counted when contracts are signed. So the timing of sales is different. |
| New Home Sales decrease to 406,000 Annual Rate in June
Posted: 24 Jul 2014 07:13 AM PDT The Census Bureau reports New Home Sales in June were at a seasonally adjusted annual rate (SAAR) of 406 thousand.
May sales were revised down from 504 thousand to 442 thousand, and April sales were revised down from 425 thousand to 408 thousand.
Click on graph for larger image.
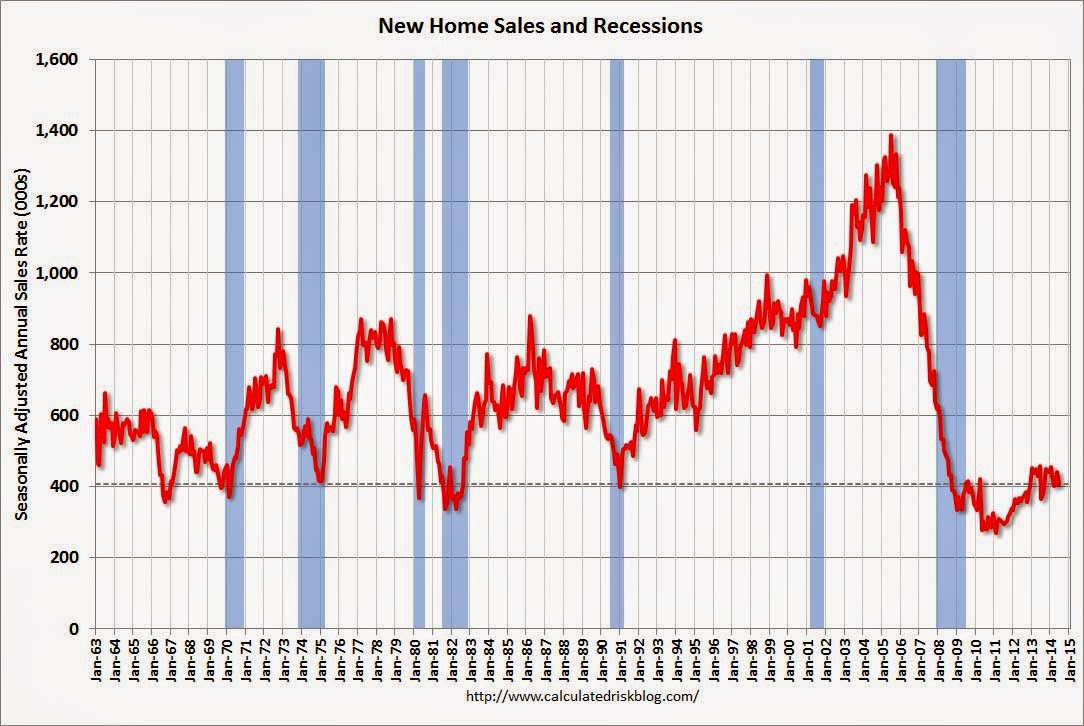
The first graph shows New Home Sales vs. recessions since 1963. The dashed line is the current sales rate. Even with the increase in sales over the previous two years, new home sales are still close to the bottom for previous recessions. The second graph shows New Home Months of Supply.
The months of supply increased in June to 5.8 months from 5.2 months in May.
The all time record was 12.1 months of supply in January 2009. This is now in the normal range (less than 6 months supply is normal).
On inventory, according to the Census Bureau:
Starting in 1973 the Census Bureau broke this down into three categories: Not Started, Under Construction, and Completed. The third graph shows the three categories of inventory starting in 1973. The inventory of completed homes for sale is still low, and the combined total of completed and under construction is also low.
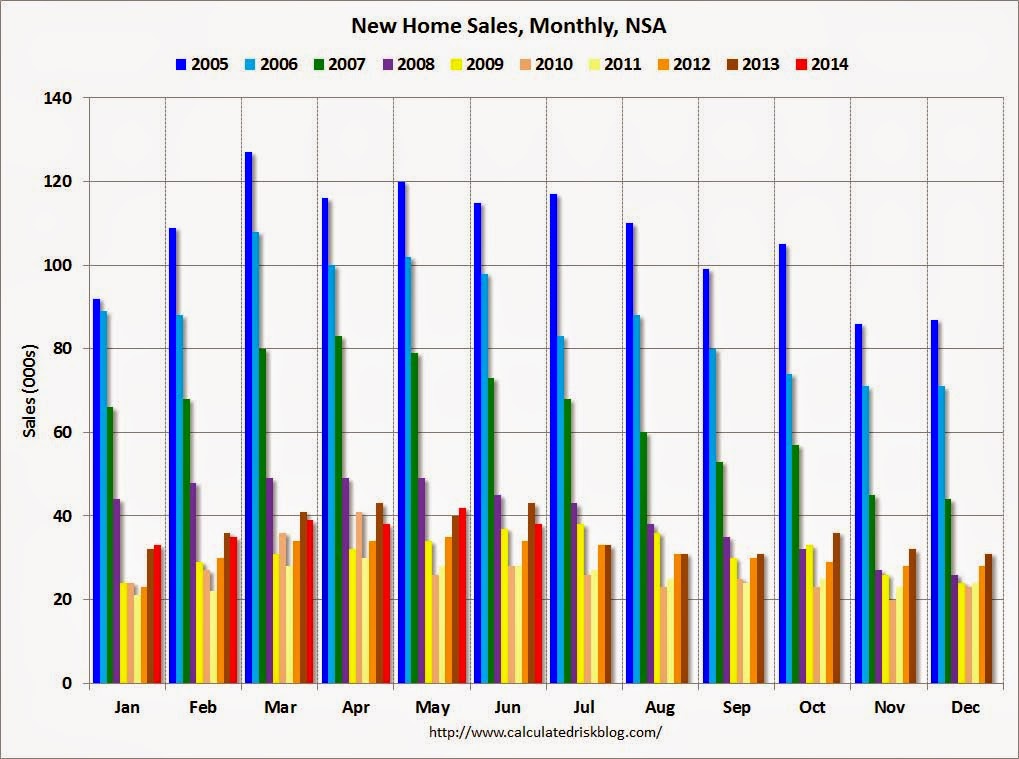
The last graph shows sales NSA (monthly sales, not seasonally adjusted annual rate).
In June 2014 (red column), 38 thousand new homes were sold (NSA). Last year 43 thousand homes were also sold in June. The high for June was 115 thousand in 2005, and the low for June was 28 thousand in 2010 and 2011. This was well below expectations of 475,000 sales in June, and sales were down 11.5% year-over-year. #nationalrealestatenews #snohomishcountyhomesrealestate
|
| Information obtained from http://www.calculatedriskblog.com
|