
| Posted: 24 Jul 2014 09:31 AM PDT
The new home sales report for June – combined with the downward revisions for previous months – was very weak.
The Census Bureau reported that new home sales this year, through June, were 225,000, Not seasonally adjusted (NSA). That is down 4.3% from 235,000 during the first half of 2013 (NSA). Maybe sales will move sideways for a little longer, but remember early 2013 was a difficult comparison period. Annual sales in 2013 were up 16.3% from 2012, but sales in the first four months of 2013 were up 26% from the same period in 2012!
Click on graph for larger image.
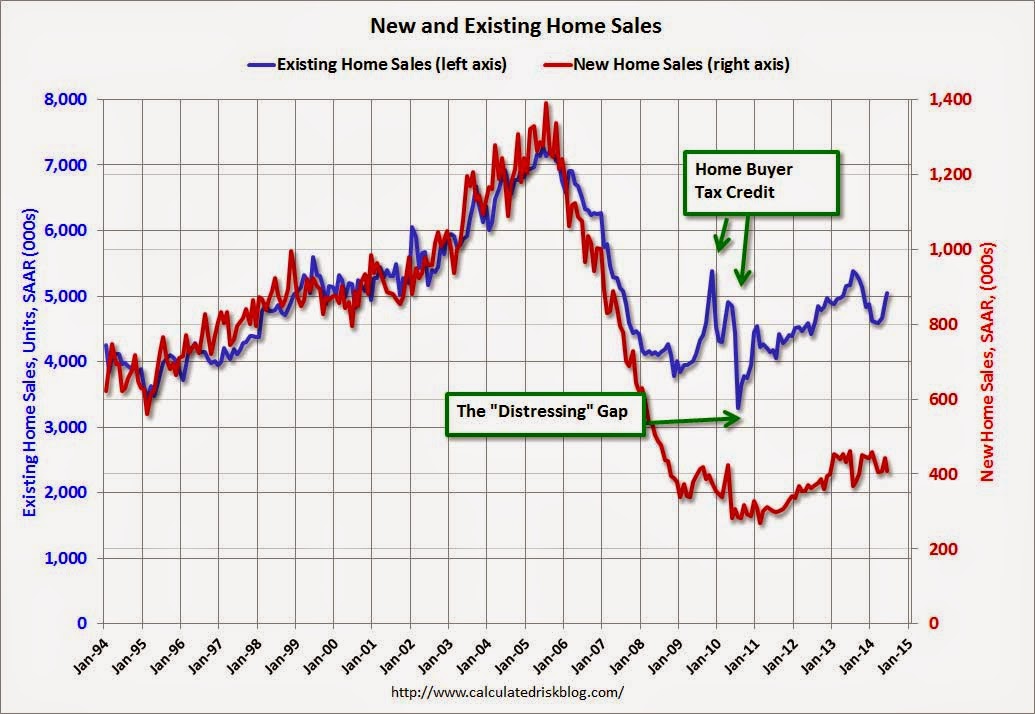
This graph shows new home sales for 2013 and 2014 by month (Seasonally Adjusted Annual Rate). The comparisons to last year will be a little easier in Q3, and I still expect to see year-over-year growth later this year. And here is another update to the “distressing gap” graph that I first started posting several years ago to show the emerging gap caused by distressed sales. Now I’m looking for the gap to close over the next few years.
The “distressing gap” graph shows existing home sales (left axis) and new home sales (right axis) through June 2014. This graph starts in 1994, but the relationship has been fairly steady back to the ’60s.
Following the housing bubble and bust, the “distressing gap” appeared mostly because of distressed sales. I expect existing home sales to decline or move sideways (distressed sales will slowly decline and be partially offset by more conventional / equity sales). And I expect this gap to slowly close, mostly from an increase in new home sales. Note: Existing home sales are counted when transactions are closed, and new home sales are counted when contracts are signed. So the timing of sales is different. |
| New Home Sales decrease to 406,000 Annual Rate in June
Posted: 24 Jul 2014 07:13 AM PDT The Census Bureau reports New Home Sales in June were at a seasonally adjusted annual rate (SAAR) of 406 thousand.
May sales were revised down from 504 thousand to 442 thousand, and April sales were revised down from 425 thousand to 408 thousand.
Click on graph for larger image.
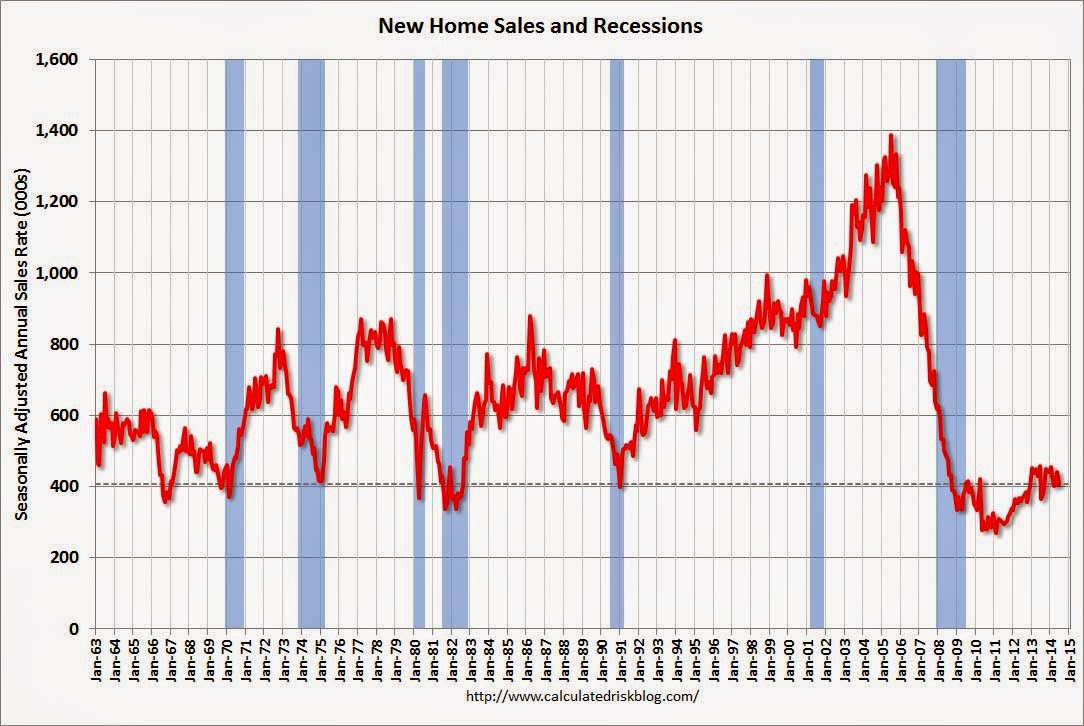
The first graph shows New Home Sales vs. recessions since 1963. The dashed line is the current sales rate. Even with the increase in sales over the previous two years, new home sales are still close to the bottom for previous recessions. The second graph shows New Home Months of Supply.
The months of supply increased in June to 5.8 months from 5.2 months in May.
The all time record was 12.1 months of supply in January 2009. This is now in the normal range (less than 6 months supply is normal).
On inventory, according to the Census Bureau:
Starting in 1973 the Census Bureau broke this down into three categories: Not Started, Under Construction, and Completed. The third graph shows the three categories of inventory starting in 1973. The inventory of completed homes for sale is still low, and the combined total of completed and under construction is also low.
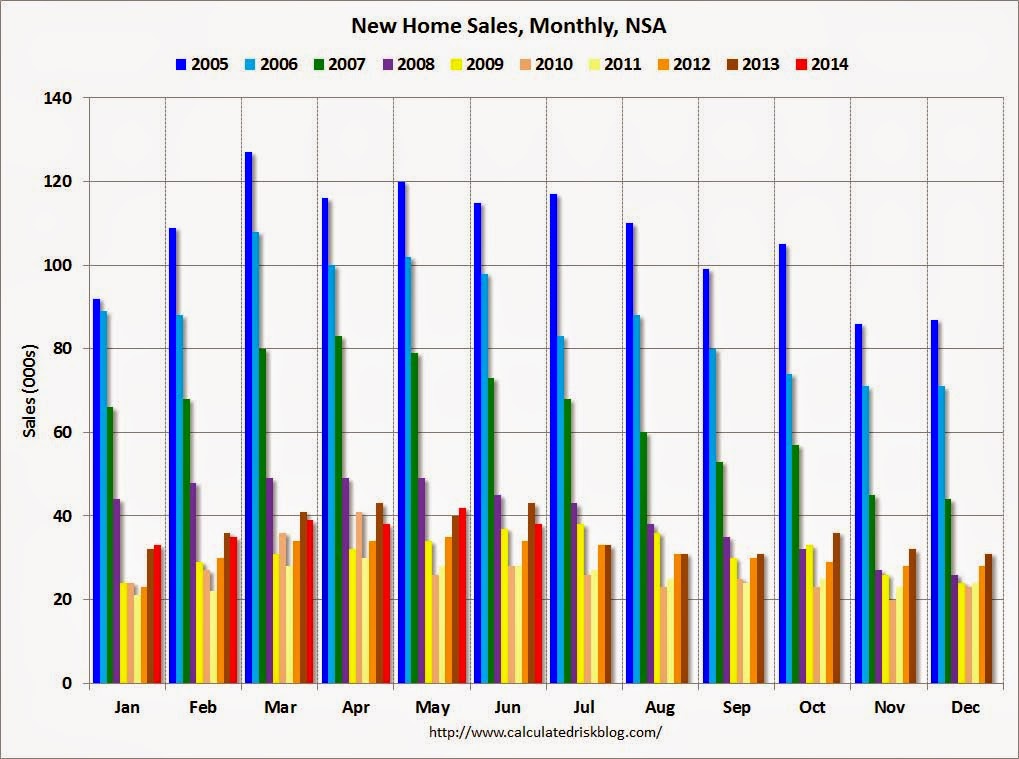
The last graph shows sales NSA (monthly sales, not seasonally adjusted annual rate).
In June 2014 (red column), 38 thousand new homes were sold (NSA). Last year 43 thousand homes were also sold in June. The high for June was 115 thousand in 2005, and the low for June was 28 thousand in 2010 and 2011. This was well below expectations of 475,000 sales in June, and sales were down 11.5% year-over-year. #nationalrealestatenews #snohomishcountyhomesrealestate
|
| Information obtained from http://www.calculatedriskblog.com
|
Category Archives: Mukilteo Real Estate


Mortgages may be easier to get than potential home buyers believe
Many potential buyers think they need near-perfect credit scores to get a home loan. But lenders may be loosening their tight underwriting standards.
WASHINGTON — Are you on the home-buying sidelines this spring because you think you won’t be able to qualify for a mortgage? Do you know what sort of FICO credit scores are being accepted by lenders at the moment — they’re lower than they were a year ago — and whether yours could now be good enough?
You may be part of the surprisingly large crowd of folks who fear the home-loan unknown. A new national consumer survey found that 56% of potential purchasers of homes say they’re out of the market because they don’t want to face the possibility of rejection by lenders. Even 30% of current homeowners believe that they wouldn’t pass muster today.
Using a statistical sample of 1,055 Americans 18 and older, survey research firm OmniTel, polling on behalf of mortgage lender LoanDepot, documented widespread uncertainty and lack of specific knowledge about current market conditions when it comes to qualifying to buy a home. According to the survey, 74% of potential buyers who would need a mortgage concede that they have not scoped out the current market or taken the steps needed to qualify.
Many potential buyers believe that they need near-perfect credit scores to get a home loan. Half of those surveyed said they had no idea what minimum FICO score is needed for a mortgage, and nearly a fifth (18%) said the minimum score might be 770 or higher.
Debt-to-income ratios are another insurmountable obstacle in many potential buyers’ eyes — enough so that they don’t even try to obtain a mortgage.
Most lenders use two forms of debt ratios: a “front end” ratio that compares the monthly costs of the proposed new mortgage and other housing expenses with the applicant’s monthly income, and a “back end” ratio comparing all recurring monthly debt obligations — housing expenses, student loans, credit cards and the like — with the applicant’s monthly income. Roughly a third of potential buyers on the sidelines believe that their debt ratios are too high.
But what’s the statistical reality on debt ratios, FICO score minimums and down payments? What are lenders approving?
The best answers come from a company called Ellie Mae, whose loan origination and tracking software is widely used by lenders. Every month Ellie Mae analyzes a huge sample of new mortgage originations nationwide and issues an overview report rich with the sort of detail that buyers sitting on the sidelines could use.
Here’s what it found in its report on March:
•Thirty-three percent of new loans last month had borrower FICO scores below 700. A year ago it was just 27%. (FICO scores max out at 850, which is considered excellent credit; applicants with scores under 700 present higher credit risks to lenders.) Federal Housing Administration-insured home purchase loans had an average FICO in March of 684. Conventional mortgages, those designed for purchase by investors Fannie Mae and Freddie Mac, still have relatively high FICOs — they averaged 755 in March, but that was down slightly from 759 a year before. Lenders are doing far fewer refinancings this year, so they are loosening up on FICO minimums for purchasers.
•Debt ratios also are more generous than many sidelined potential borrowers probably imagine. The FHA’s average front-end (housing costs) ratio last month for purchase loans was 28%. In other words, if your projected housing and mortgage-related costs represent 28% of monthly income, you’re average. Fannie Mae and Freddie Mac loans averaged 22% ratios on the front end. Back-end (total recurring debt) ratios for FHA averaged 41%. For Fannie and Freddie it was lower — 34%.
•Down payments can be small if that’s what you need. FHA’s average down payment last month for home purchases was 5%, but many borrowers put down just 3.5%. Fannie and Freddie allow 5% down as well, provided that you can pay mortgage insurance premiums. VA loans can go to zero down if your veterans status allows you to qualify. Department of Agriculture home buyer loans, which are designed for people who live in small towns, also allow for no down payments.
The point here: If you’re on the sidelines, check out what’s really going on in the mortgage market. There may be more opportunities — even in an era of tighter underwriting — than you think.
Article by Ken Harvey
Short and Sweet Mortgage & Real Estate News you can use~ for the Puget Sound Region

Thanks to one of the wonderful Title and Escrow companies I use here are some great tips and articles I wanted to forward to all my readers. Great information!
MORTGAGE & FINANCE news
Tips for preparing your 2013 taxes:
Top 10 Mortgage Tips for 2014:
King County home prices rise 10.5% for 2013:
REAL ESTATE news
Why 2014 is a good year to buy a home:
Dont forget I am here when you are ready to buy or sell!
Tips for downsizing:
LOCAL news
Steady job growth in 2014
Have a wonderful Wednessday! Half way through the week already…… and GO HAWKS!
Winter Coziness and Home Tips.
“Winter is time for comfort and warmth, it is a time for home” Edith Sitwell
Just a few hightlights of warmth for this month
Check out Zillows cozy cabins and rustic fireplace designs they look all so heavenly!

And with all this coziness I just have to add a “Did you know”?
Of about the 350 million cans of chicken noodle soup of all commercial brands sold annually in the United States, 60 percent is purchased during the cold and flu season. January is the top-selling month of the year!
Today January 10th is National Cut your Energy Costs Day. Here are a few energy tips and Winter Home Maintenance Tips for this Winter. Do these first and then enjoy a cozy fire!
Maintenance TIPS Winter
YOUR HOME may be the biggest investment you make. Proper house maintenance
ensures a safe and comfortable environment for you and your family. Here are helpful tips
and reminders of chores you may have overlooked for preparation this winter season.
• Clean faucet aerators and showerheads.
• Clean refrigerator drain pan and vacuum condenser coil.
• Clean kitchen exhaust fan filters.
• Vacuum bathroom vent fan covers.
• Clean dishwasher food filters and check that openings in spray arms are clear.
• Examine caulk and grout in shower, repair as needed.
• Clean and seal grout.
• Exercise (turn on and off) plumbing shutoff valves. Just in case you may need to in an emergency.
• Exercise circuit breakers.
• Test relief valve on water heater.
• Vacuum smoke detectors, heating registers, vents, ducts and radiators.
• Clean out dryer vent duct.
These will save energy and ensure a safe home!
US. Housing Price Appreciation and Real Estate News
Real Estate News
In 2013, the housing markets with the biggest increases in asking prices were all rebounding from severe price drops in the housing bust. Home prices are still in rebound mode, but this effect will weaken in 2014. Job growth, in contrast, mattered little for price gains in 2013 but helped drive rent increases.
In December, the year-over-year increase in asking home prices slowed for the first time since the price recovery began in early 2012: prices rose 11.9% year-over-year in December, compared with November’s 12.2% year-over-year increase. Asking prices rose 0.4% month-over-month, seasonally adjusted, the third straight month of gains less than 1%.
Overall, regression analysis shows that recent price gains are most strongly associated with the severity of the local housing bust. Markets where prices fell most during the bust (roughly 2006 to 2011, but varies by metro) offered bargains for investors and other buyers who have helped bid prices back up over the past two years. A second important factor is foreclosures: adjusting for other factors, metros with a higher foreclosure inventory today – including many in Florida – have slower price growth. Job growth, however, had little impact on local home price gains in 2013: the relationship between job growth and price gains was positive but not statistically significant.
Therefore, year-over-year price gains in December 2013 are still primarily a reaction to the housing bust, but this rebound effect is fading as we enter 2014. Looking at the quarter-over-quarter price changes throughout 2013, the relationship between the severity of the housing bust and the recent price recovery was stronger earlier in the year than later in the year. More specifically, the correlation between peak-to-trough price change (FHFA) and the Trulia Price Monitor quarter-over-quarter change was -.59 in March; -.45 in June; -.43 in September; and -.33 in December. This correlation is moving closer to zero, which signifies that the rebound effect is fading. As the housing market continues to recover, factors other than the rebound effect – like job growth – will matter more for price gains. That means slower but more sustainable price increases.
Note: These asking prices are SA (Seasonally Adjusted) – and adjusted for the mix of homes – and this suggests further house price increases, but at a slower rate, over the next few months on a seasonally adjusted basis.
From Trulia chief economist Jed Kolko: The Post-Crash Rebound, Not Job Growth, Drove 2013 Price Gains
Interactive Chart
Please take a look at this great interactive PDF with a map and average home price appreciation info for the entire United States by clicking through to this link, you’ll find the US Map and much more state specific data in an interactive version.

We hope you find this information useful and never hesitate if you would like to see more or would like more information.
http://www.snohomishcountyhomes4u.com
US. Housing Price Appreciation and Real Estate News.
Real Estate News
In 2013, the housing markets with the biggest increases in asking prices were all rebounding from severe price drops in the housing bust. Home prices are still in rebound mode, but this effect will weaken in 2014. Job growth, in contrast, mattered little for price gains in 2013 but helped drive rent increases.
In December, the year-over-year increase in asking home prices slowed for the first time since the price recovery began in early 2012: prices rose 11.9% year-over-year in December, compared with November’s 12.2% year-over-year increase. Asking prices rose 0.4% month-over-month, seasonally adjusted, the third straight month of gains less than 1%.
…
Overall, regression analysis shows that recent price gains are most strongly associated with the severity of the local housing bust. Markets where prices fell most during the bust (roughly 2006 to 2011, but varies by metro) offered bargains for investors and other buyers who have helped bid prices back up over the past two years. A second important factor is foreclosures: adjusting for other factors, metros with a higher foreclosure inventory today – including many in Florida – have slower price growth. Job growth, however, had little impact on local home price gains in 2013: the relationship between job growth and price gains was positive but not statistically significant.Therefore, year-over-year price gains in December 2013 are still primarily a reaction to the housing bust, but this rebound effect is fading as we enter 2014. Looking at the quarter-over-quarter price changes throughout 2013, the relationship between the severity of the housing bust and the recent price recovery was stronger earlier in the year than later in the year. More specifically, the correlation between peak-to-trough price change (FHFA) and the Trulia Price Monitor quarter-over-quarter change was -.59 in March; -.45 in June; -.43 in September; and -.33 in December. This correlation is moving closer to zero, which signifies that the rebound effect is fading.
As the housing market continues to recover, factors other than the rebound effect – like job growth – will matter more for price gains. That means slower but more sustainable price increases.
Note: These asking prices are SA (Seasonally Adjusted) – and adjusted for the mix of homes – and this suggests further house price increases, but at a slower rate, over the next few months on a seasonally adjusted basis.
From Trulia chief economist Jed Kolko: The Post-Crash Rebound, Not Job Growth, Drove 2013 Price Gains
Interactive Chart
Please take a look at this great interactive PDF with a map and average home price appreciation info for the entire United States by clicking through to this link, you’ll find the US Map and much more state specific data in an interactive version.
We hope you find this information useful and never hesitate if you would like to see more or would like more information.

Happy New Year January’s Newsletter
Happy New Year Everyone!
Well I have to admit I have been a bit slow getting back in the swing of things! It is however a New Year and time to make it a great one! I want to thank my wonderful Home Buyers and Sellers of last year and I look forward to assisting more first time home buyers, those that are ready to make a move to our great state or those that may want to up-size or down-size.
Regardless of “why” I am here to help you with the “how” and “when.” To get it done and make your dream of home ownership a reality!


Beautiful New Home in Mukilteo is the Home Of The Week

$1,150,000 , 5 bedrooms, 4 full baths, 1 half baths, 4,261 square feet
|
|||||||||||||||||||||||||||||||||||||||||||||||||||||||
|
|||||||||||||||||||||||||||||||||||||||||||||||||||||||
|
|||||||||||||||||||||||||||||||||||||||||||||||||||||||
|
|||||||||||||||||||||||||||||||||||||||||||||||||||||||


|
Posted: Nov 13, 2013, 6:04pm PST
|
Monthly Mortgage News
News from NW Multiple Listing Service
FOR IMMEDIATE RELEASE: November 5, 2013
Home sales “pause” with government shutdown,
but brokers mostly bullish on market recovery
but brokers mostly bullish on market recovery
Kirkland, WA – November 5, 2013. Home sales “paused” during October but prices continued to rise, according to the latest statistics from Northwest Multiple Listing Service. Commenting on year-to-date totals for 2013 compared to 2012, one industry expert remarked, “I would say the real estate market is recovering nicely.”
Pending sales during October dipped 2.7 percent when compared to the same month a year ago, but rose nearly 3.2 percent from September’s volume. October’s decline was the first negative change in year-over-year comparisons since April 2011. (That drop-off was attributed in part to a frenzy during April 2010 when buyers were scrambling to take advantage of a federal tax credit that was expiring.)
Brokers point to the federal shutdown during the first two weeks of October, below-normal inventory, and shaken consumer confidence as factors in the slowdown.
MLS figures summarizing last month’s activity across the 21 counties in its service area show year-over-year improvement in inventory (up 5.5 percent), double-digit increases in the volume of closed sales (up 12.5 percent), and moderate increases in selling prices (up 7.7 percent).
Mike Gain, president and CEO of Prudential Northwest Realty Associates, believes the market has taken a “slight pause,” but emphasized one month’s numbers don’t indicate a trend.
“We are two years into what has been a very steady recovery. It’s okay – and actually healthy – to have a slight slowdown,” he remarked. The government shutdown “definitely hurt consumer confidence” and put many would-be buyers on the sidelines, according to Gain.
Consumer confidence “deteriorated considerably” in October as a result of the shutdown and debt ceiling squabbles, according to The Conference Board. A recent Gallup poll found some improvement in Americans’ economic confidence, but reported it is still well below mid-September, before the shutdown.
Gain said despite improving inventory the limited supply of homes for sale is also hampering sales. “Numerous buyers are looking but just can’t find the right home to fit their needs,” he reported.
Northwest MLS brokers reported 8,086 pending sales during October, down from the year-ago total of 8,312 sales, but outgaining the number of mutually accepted offers in September by 247 transactions for a 3.2 percent increase. Eleven counties had fewer pending sales last month versus a year ago.
In King and Snohomish counties the “torrid pace” of home sales activity has eased to a “healthy/strong level,” observed J. Lennox Scott, chairman and CEO of John L. Scott Real Estate. He believes the housing market is transitioning from a recovery market to a sustainable mode.
Prices on sales that closed last month rose 7.7 percent ($19,375) from a year ago. Area-wide, the median price for single family homes and condominiums (combined) was $271,000.
Homes that sold in San Juan County last month fetched the highest median price at $384,000, up 17.2 percent from a year ago. King County prices were slightly lower at $380,000, about 11 percent more than the median price of a year ago.
For single family homes only (excluding condos), King County prices topped the list. The median price for last month’s completed sales was $426,000, or 15.1 percent higher than the year-ago selling price of $370,000. System-wide, the median price for single family homes (only) was $283,000, about 8.4 percent higher than twelve months ago when it was $261,050.
Gain said the increases reflect a healthy and stabilizing real estate market. “It is good to see the prices rising modestly, allowing the market to become more balanced,” he stated.
Northwest MLS director George Moorhead agreed, saying more moderate and balanced growth helps “mitigate huge home price fluctuations.” The slowdown is also reflected in the time it is taking listings to sell, he noted. “We are seeing inventory staying on the market longer, which will continue through the holiday season until late January to mid-February,” said Moorhead, the managing broker at Bentley Properties in Bothell.
More inventory is still needed to meet demand, suggested Dick Beeson, principal managing broker at RE/MAX Professionals in Tacoma and a past chairman of the Northwest MLS board of directors. In Pierce County, where his office is located, inventory is about even with year-ago levels, but 2,019 more sales have closed so far this year for a jump of 25.4 percent.
Three counties – King, Pierce and Snohomish – have less than three months of supply, well below the 4-to-6 month level that is generally considered to be an indicator of a balanced market.
“It still looks like a potential housing shortage in Puget Sound come 2015 if building doesn’t increase,” Beeson commented.
At least one segment of the new construction market shows signs of rebounding: condominiums.
“Most residential developers went into hibernation during the real estate bear market of the past five years, but this past month heralded a bullish resurgence of several developments,” said John Deely, a member of the Northwest MLS board of directors. Last month was like spring in the South Lake Union neighborhood, he reported.
Deely, the principal managing broker at Coldwell Banker Bain in Seattle, cited the opening of sales for a new 41-story condominium community and the restart of two other major residential developments as positive indicators. The projects include a high-rise residential development near the Space Needle and the restart of a hotel-condo building in the Denny Triangle area of downtown Seattle. “This is good news as the market is starving for new condominium inventory,” he stated.
Beeson also commented on upticks in condo activity. He said some condo developers who placed units in the rental pool during the 2008-2010 downturn are converting them back to for-sale housing and trying to sell them in today’s improved market. “The price points have still not returned to 2006-2007 levels but the chance to move some product now exists,” he commented.
MLS brokers added more than 1,000 new listings to condo inventory last month, a jump of 24.3 percent from a year ago. Total inventory is 9.1 percent higher than at this time last year. Closed sales during October jumped 15.3 percent, with prices rising about 5.3 percent.
Condos that closed during October had a median price of $200,000. In King County, which accounted for about two-thirds of those sales, the median price was $234,000.
“The real estate market has been moving in the right direction,” observed Gain, adding, “It has been a huge improvement over the past several years.” To underscore his point, he noted pending sales year-to-date are up by nearly 6,000 units (at 5,994) for a 7.3 percent increase. YTD closed sales are already up 10,167 units from a year ago for an increase of almost 19 percent (18.8), and prices are up by $27,000 for an increase of 11.1 percent. “I would say the real estate market is recovering nicely,” he concluded.
Northwest Multiple Listing Service, owned by its member real estate firms, is the largest full-service MLS in the Northwest. Its membership includes more than 21,000 real estate brokers. The organization, based in Kirkland, Wash., currently serves 21 counties in Washington state.
Statistical Summary by Counties: Market Activity Summary – October 2013
| Single Family Homes + Condos |
LISTINGS | PENDING SALES |
CLOSED SALES | MONTHS SUPPLY |
|||
| New Listings |
Total Active |
# Pending Sales |
# Closings |
Avg. Price |
Median Price |
||
| King |
3,047
|
5,799
|
3,306
|
2,798
|
$461,138
|
$380,000
|
1.75
|
| Snohomish |
1,217
|
2,629
|
1,219
|
1,041
|
$293,894
|
$270,000
|
2.16
|
| Pierce |
1,217
|
3,571
|
1,324
|
1,014
|
$236,761
|
$217,898
|
2.70
|
| Kitsap |
400
|
1,483
|
373
|
328
|
$286,658
|
$244,975
|
3.98
|
| Mason |
113
|
710
|
91
|
75
|
$194,380
|
$165,800
|
7.80
|
| Skagit |
174
|
796
|
180
|
150
|
$268,572
|
$232,710
|
4.42
|
| Grays Hbr |
115
|
757
|
109
|
77
|
$121,497
|
$118,000
|
6.94
|
| Lewis |
89
|
696
|
79
|
54
|
$156,788
|
$148,700
|
8.81
|
| Cowlitz |
111
|
456
|
114
|
107
|
$172,207
|
$153,000
|
4.00
|
| Grant |
102
|
501
|
74
|
54
|
$161,476
|
$148,000
|
6.77
|
| Thurston |
380
|
1,276
|
370
|
302
|
$222,805
|
$203,495
|
3.45
|
| San Juan |
27
|
389
|
22
|
25
|
$450,260
|
$384,000
|
17.68
|
| Island |
150
|
757
|
139
|
112
|
$270,065
|
$255,000
|
5.45
|
| Kittitas |
64
|
440
|
57
|
60
|
$238,981
|
$201,675
|
7.72
|
| Jefferson |
52
|
428
|
58
|
38
|
$259,120
|
$267,000
|
7.38
|
| Okanogan |
54
|
482
|
34
|
23
|
$211,470
|
$128,000
|
14.18
|
| Whatcom |
272
|
1,440
|
276
|
280
|
$282,221
|
$249,000
|
5.22
|
| Clark |
60
|
207
|
55
|
36
|
$269,104
|
$239,000
|
3.76
|
| Pacific |
44
|
429
|
37
|
31
|
$142,745
|
$124,000
|
11.59
|
| Ferry |
8
|
69
|
2
|
3
|
$89,667
|
$79,000
|
34.50
|
| Clallam |
56
|
397
|
63
|
58
|
$216,245
|
$200,000
|
6.30
|
| Others |
142
|
679
|
104
|
86
|
$222,125
|
$194,500
|
6.53
|
| MLS TOTAL |
7,894
|
24,391
|
8,086
|
6,752
|
$339,607
|
$271,000
|
3.02
|
4-County Puget Sound Region Pending Sales (SFH + Condo combined)
(Totals include King, Snohomish, Pierce & Kitsap counties)
(Totals include King, Snohomish, Pierce & Kitsap counties)
| Jan | Feb | Mar | Apr | May | Jun | Jul | Aug | Sep | Oct | Nov | Dec | |
| 2000 | 3706 | 4778 | 5903 | 5116 | 5490 | 5079 | 4928 | 5432 | 4569 | 4675 | 4126 | 3166 |
| 2001 | 4334 | 5056 | 5722 | 5399 | 5631 | 5568 | 5434 | 5544 | 4040 | 4387 | 4155 | 3430 |
| 2002 | 4293 | 4735 | 5569 | 5436 | 6131 | 5212 | 5525 | 6215 | 5394 | 5777 | 4966 | 4153 |
| 2003 | 4746 | 5290 | 6889 | 6837 | 7148 | 7202 | 7673 | 7135 | 6698 | 6552 | 4904 | 4454 |
| 2004 | 4521 | 6284 | 8073 | 7910 | 7888 | 8186 | 7583 | 7464 | 6984 | 6761 | 6228 | 5195 |
| 2005 | 5426 | 6833 | 8801 | 8420 | 8610 | 8896 | 8207 | 8784 | 7561 | 7157 | 6188 | 4837 |
| 2006 | 5275 | 6032 | 8174 | 7651 | 8411 | 8094 | 7121 | 7692 | 6216 | 6403 | 5292 | 4346 |
| 2007 | 4869 | 6239 | 7192 | 6974 | 7311 | 6876 | 6371 | 5580 | 4153 | 4447 | 3896 | 2975 |
| 2008 | 3291 | 4167 | 4520 | 4624 | 4526 | 4765 | 4580 | 4584 | 4445 | 3346 | 2841 | 2432 |
| 2009 | 3250 | 3407 | 4262 | 5372 | 5498 | 5963 | 5551 | 5764 | 5825 | 5702 | 3829 | 3440 |
| 2010 | 4381 | 5211 | 6821 | 7368 | 4058 | 4239 | 4306 | 4520 | 4350 | 4376 | 3938 | 3474 |
| 2011 | 4272 | 4767 | 6049 | 5732 | 5963 | 5868 | 5657 | 5944 | 5299 | 5384 | 4814 | 4197 |
| 2012 | 4921 | 6069 | 7386 | 7015 | 7295 | 6733 | 6489 | 6341 | 5871 | 6453 | 5188 | 4181 |
| 2013 | 5548 | 6095 | 7400 | 7462 | 7743 | 7374 | 7264 | 6916 | 5951 | 6222 |
__________
Did someone die in this house?
A new site lets you search this question …
Yesterday was Halloween and I hope you all had a nice and “sweet” one. One of the lenders I use sent me this tid bit in honor of Halloween and I thought it was pretty interesting. So many times I have been asked “Do you know if anyone died here”? Unless the seller discloses that information on what is referred to as a Form 17; I have no idea. However, if it’s an Estate sale then it’s a pretty darn good assumption someone did.
Now there is a site that answers this question. Yes, there is a small fee but for those that just have to know it might be worth it.

Manressa Castle, Port Townsend, WA
Story behind the site :
A Text in the night put Roy Condrey on the trail of the dead.
“Did you know that your house is haunted?” read the letters glowing on his screen. It wasn’t a message from beyond, but rather came from one of the tenants in the properties he rents out to supplement his income as a software project manager.
But the text got him pondering: Even if you suspected you had a paranormal force inhabiting your home, how could you tell if someone died in it?
Thus was Diedinhouse.com born. The site cross references between public records and other databases to find who used to live in a particular U.S. address, whether they’re alive or not, and if they died while in the house. It can tell prospective homebuyers information the seller isn’t obligated to disclose, which can sometimes lower a house’s final price.
That night the idea was germinating; Condrey sat in front of the computer and began searching for answers. He discovered it’s not that easy to electronically dig up a body under your roof.
From one source he could get a list of everyone who lived in the house. Then he had to check each name against another list to see if they were alive. Other databases and searches could turn up clues as to whether their death happened at the address itself. Few states require sellers to disclose if anyone died in the home, even if it was a murder-suicide that everyone else in the neighborhood knows about. By and large, it’s let the buyer beware … of ghosts.
In that informational void Condrey saw opportunity. He grabbed a few programmer pals, and in June of this year his website was spawned. In the first five months, it sold a few thousand reports for $11.99 per U.S. address searched.
A few Halloween-minded media mentions later and it’s now selling a thousand per day…..go figure ~