
TUESDAY REAL ESTATE TIP ~FICO score. What does yours mean?


4 Beds, 3 Baths | 1,770 sq. ft. | Single-Family- Marysville

4 Beds, 3 Baths | 2004 sq ft. | Single-Family-Silver Firs

4 Beds, 2.5 Baths | 2,410 sq. ft. | Single-Family-Lake Stevens.
You will adore this home and its beautiful features! Kitchen has tons of counter space and plenty of cabinets to meet your cooking needs the kitchen island also provides additional prep space that you will be sure to love! You will absolutely love the fireplace in the open family room area, perfect on a chilly North West day. You will appreciate the easy floor plan of the upper level of the home where all bedrooms are located. HUGE fenced backyard is great for entertaining needs! WELCOME HOME!
Sneak Peak! Do you know there are some great bank owned homes from Fannie Mae coming soon? Here is one in Bothell that will hit the market in a few weeks. 1994 Rambler with nice tile floors, island kitchen, gas fireplace, 3 bdrm/ 2 bath/ 1632 sq ft. List price will be under $340K. Want more info? Hurry and ask BEFORE it hits the market.

This one is going on tomorrow! Turn Key FHA approved town home ready for new owner! Located in a small gated community surrounded by new homes & natural growth protected area. This Private & spacious home sits in back of the complex backing up to green belt. W/ Large living space of 1128sq. ft. & a 525 sq. ft garage w/additional storage you have room for everything. Features lots of large windows, hardwoods in kitchen & bath, gas stove, gas fireplace, gas heat & all appliances. Min. to Everett Boeing, Muk. Schools & Shopping. $165K


You have finally closed on your new home and with great rates and a beautiful home you can now relax all the hard work is over right? Not exactly. So get settled in and get use to a mortgage payment then, after a few months take a look on how you can get that mortgage down a bit faster.
Either right away, or in the future, there is a better way to pay that 30 year mortgage down quicker and build your equity faster. Here is a current payment schedule based on a approximate 4 1/8% rate. As you can see the first few years you are paying an astronomic amount in interest. Just think of what just one extra payment a year could do for you.
Here is a link to a great site I give to my buyers and sellers. While I am not a mortgage broker (I work with some great ones) I do believe all of us Realtors should provide better tools to our clients and be informed. After all, a home buyer, or seller, who understands the process is more comfortable with their home and their purchase.
Not only does this site have mortgage calculators. Check it out there is every kind of financial calculator you can think of. It actually is a bit addicting so have fun with it!
|
Year |
Total Payments |
Principal Paid |
Interest Paid |
Ending Principal Balance |
|---|---|---|---|---|
| $300,000.00 | ||||
| 1 | $17,395.20 | $5,192.05 | $12,203.15 | $294,807.95 |
| 2 | $17,395.20 | $5,408.99 | $11,986.21 | $289,398.96 |
| 3 | $17,395.20 | $5,634.96 | $11,760.24 | $283,764.00 |
| 4 | $17,395.20 | $5,870.37 | $11,524.83 | $277,893.63 |
| 5 | $17,395.20 | $6,115.61 | $11,279.59 | $271,778.02 |
| 6 | $17,395.20 | $6,371.14 | $11,024.06 | $265,406.88 |
| 7 | $17,395.20 | $6,637.34 | $10,757.86 | $258,769.54 |
| 8 | $17,395.20 | $6,914.62 | $10,480.58 | $251,854.92 |
| 9 | $17,395.20 | $7,203.53 | $10,191.67 | $244,651.39 |
| 10 | $17,395.20 | $7,504.47 | $9,890.73 | $237,146.92 |
| 11 | $17,395.20 | $7,818.00 | $9,577.20 | $229,328.92 |
| 12 | $17,395.20 | $8,144.63 | $9,250.57 | $221,184.29 |
| 13 | $17,395.20 | $8,484.91 | $8,910.29 | $212,699.38 |
| 14 | $17,395.20 | $8,839.40 | $8,555.80 | $203,859.98 |
| 15 | $17,395.20 | $9,208.70 | $8,186.50 | $194,651.28 |
| 16 | $17,395.20 | $9,593.44 | $7,801.76 | $185,057.84 |
| 17 | $17,395.20 | $9,994.27 | $7,400.93 | $175,063.57 |
| 18 | $17,395.20 | $10,411.80 | $6,983.40 | $164,651.77 |
| 19 | $17,395.20 | $10,846.79 | $6,548.41 | $153,804.98 |
| 20 | $17,395.20 | $11,299.97 | $6,095.23 | $142,505.01 |
| 21 | $17,395.20 | $11,772.08 | $5,623.12 | $130,732.93 |
| 22 | $17,395.20 | $12,263.90 | $5,131.30 | $118,469.03 |
| 23 | $17,395.20 | $12,776.27 | $4,618.93 | $105,692.76 |
| 24 | $17,395.20 | $13,310.07 | $4,085.13 | $92,382.69 |
| 25 | $17,395.20 | $13,866.14 | $3,529.06 | $78,516.55 |
| 26 | $17,395.20 | $14,445.46 | $2,949.74 | $64,071.09 |
| 27 | $17,395.20 | $15,049.00 | $2,346.20 | $49,022.09 |
| 28 | $17,395.20 | $15,677.73 | $1,717.47 | $33,344.36 |
| 29 | $17,395.20 | $16,332.74 | $1,062.46 | $17,011.62 |
| 30 | $17,391.71 | $17,011.62 | $380.09 |
$0.00 |
#snohomishcountyrealestate #mortgagecalculators
Information and interactive calculators are made available to you as self-help tools for your independent use and are not intended to provide investment advice. We cannot and do not guarantee their applicability or accuracy in regards to your individual circumstances. All examples are hypothetical and are for illustrative purposes. We encourage you to seek personalized advice from qualified professionals regarding all personal finance issues.
| Posted: 24 Jul 2014 09:31 AM PDT
The new home sales report for June – combined with the downward revisions for previous months – was very weak.
The Census Bureau reported that new home sales this year, through June, were 225,000, Not seasonally adjusted (NSA). That is down 4.3% from 235,000 during the first half of 2013 (NSA). Maybe sales will move sideways for a little longer, but remember early 2013 was a difficult comparison period. Annual sales in 2013 were up 16.3% from 2012, but sales in the first four months of 2013 were up 26% from the same period in 2012!
Click on graph for larger image.
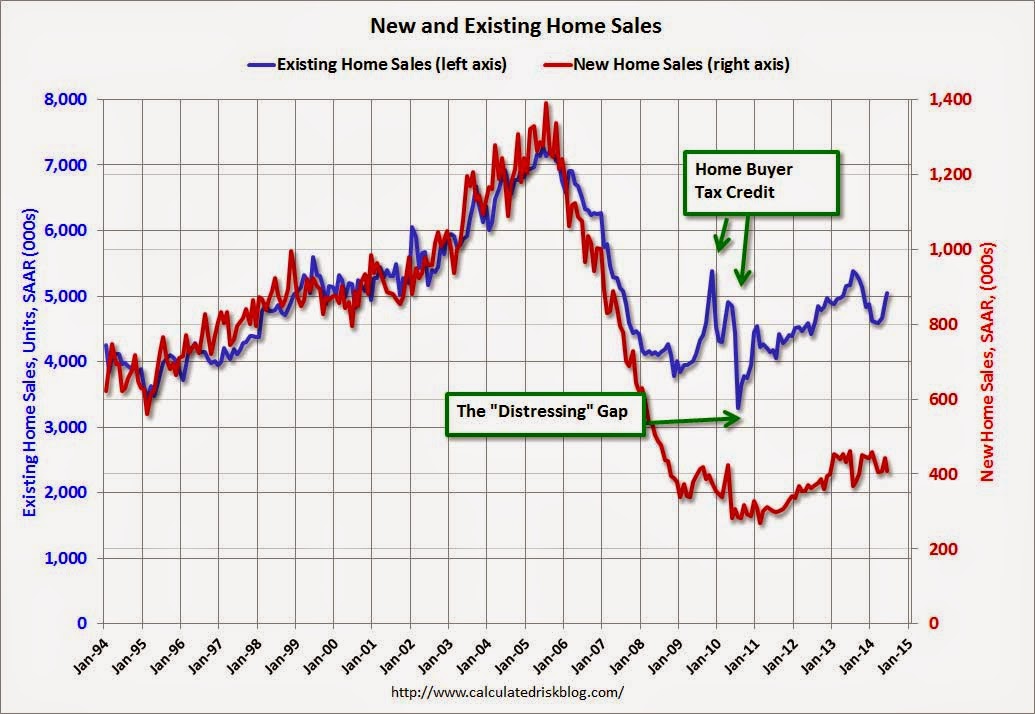
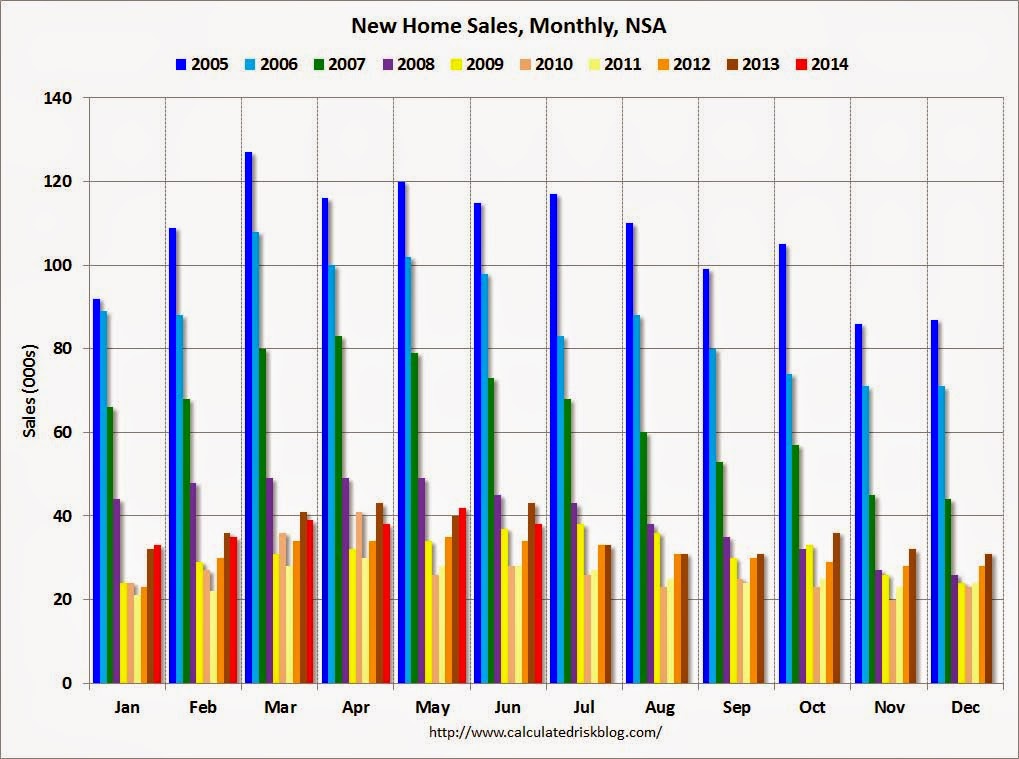
This graph shows new home sales for 2013 and 2014 by month (Seasonally Adjusted Annual Rate). The comparisons to last year will be a little easier in Q3, and I still expect to see year-over-year growth later this year. And here is another update to the “distressing gap” graph that I first started posting several years ago to show the emerging gap caused by distressed sales. Now I’m looking for the gap to close over the next few years.
The “distressing gap” graph shows existing home sales (left axis) and new home sales (right axis) through June 2014. This graph starts in 1994, but the relationship has been fairly steady back to the ’60s.
Following the housing bubble and bust, the “distressing gap” appeared mostly because of distressed sales. I expect existing home sales to decline or move sideways (distressed sales will slowly decline and be partially offset by more conventional / equity sales). And I expect this gap to slowly close, mostly from an increase in new home sales. Note: Existing home sales are counted when transactions are closed, and new home sales are counted when contracts are signed. So the timing of sales is different. |
| New Home Sales decrease to 406,000 Annual Rate in June
Posted: 24 Jul 2014 07:13 AM PDT The Census Bureau reports New Home Sales in June were at a seasonally adjusted annual rate (SAAR) of 406 thousand.
May sales were revised down from 504 thousand to 442 thousand, and April sales were revised down from 425 thousand to 408 thousand.
Click on graph for larger image.
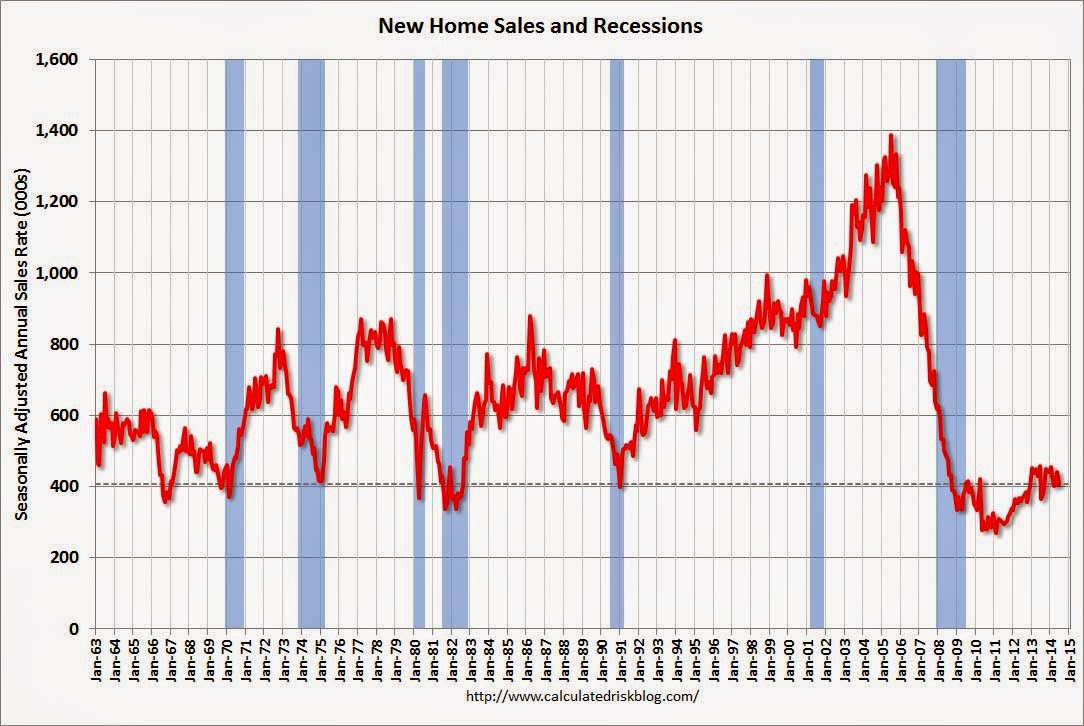
The first graph shows New Home Sales vs. recessions since 1963. The dashed line is the current sales rate. Even with the increase in sales over the previous two years, new home sales are still close to the bottom for previous recessions. The second graph shows New Home Months of Supply.
The months of supply increased in June to 5.8 months from 5.2 months in May.
The all time record was 12.1 months of supply in January 2009. This is now in the normal range (less than 6 months supply is normal).
On inventory, according to the Census Bureau:
Starting in 1973 the Census Bureau broke this down into three categories: Not Started, Under Construction, and Completed. The third graph shows the three categories of inventory starting in 1973. The inventory of completed homes for sale is still low, and the combined total of completed and under construction is also low.
The last graph shows sales NSA (monthly sales, not seasonally adjusted annual rate).
In June 2014 (red column), 38 thousand new homes were sold (NSA). Last year 43 thousand homes were also sold in June. The high for June was 115 thousand in 2005, and the low for June was 28 thousand in 2010 and 2011. This was well below expectations of 475,000 sales in June, and sales were down 11.5% year-over-year. #nationalrealestatenews #snohomishcountyhomesrealestate
|
| Information obtained from http://www.calculatedriskblog.com
|
MORTGAGE & FINANCE news
7 steps to help you navigate the mortgage process
5 tips for unmarried couples buying a house together
5 tips to help you win a bidding war for your new home
REAL ESTATE news
Seattle-Bellevue-Everett Metro area 3rd fastest-moving housing market in U.S.
Home Tips
So you boldly painted a wall a vibrant red. Now what?
5 ways to turn that drab deck into a relaxing summer oasis
Tips for cutting down waste while entertaining this summer
Water conservation tips for Seattle and all Puget Sound homeowners
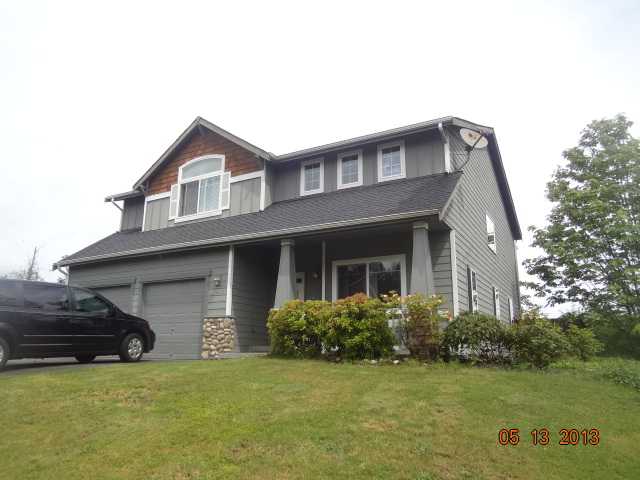
Just for fun! Take a look at this Everett Home listed for Sale.
What a view of the Cascades and the entire Snohomish Valley! Can you imagine waking up each morning and having coffee on the deck to this? Its one of the very many scenic views our community offers and is the reason I call this area home.

#snohomishcountyrealestate
#snohomishcountyhomesforsale
Quickly calculate if your home was a good investment
Top 10 things you need to know when buying a house

Buyers hope to make their offer stand apart with personal appeals to sellers
7 things buyers love and seller’s fail to mention
And just for fun do you know its the Great American Backyard Campout this weekend? If its not raining this weekend try it and have some fun!


WASHINGTON — Are you on the home-buying sidelines this spring because you think you won’t be able to qualify for a mortgage? Do you know what sort of FICO credit scores are being accepted by lenders at the moment — they’re lower than they were a year ago — and whether yours could now be good enough?
You may be part of the surprisingly large crowd of folks who fear the home-loan unknown. A new national consumer survey found that 56% of potential purchasers of homes say they’re out of the market because they don’t want to face the possibility of rejection by lenders. Even 30% of current homeowners believe that they wouldn’t pass muster today.
Using a statistical sample of 1,055 Americans 18 and older, survey research firm OmniTel, polling on behalf of mortgage lender LoanDepot, documented widespread uncertainty and lack of specific knowledge about current market conditions when it comes to qualifying to buy a home. According to the survey, 74% of potential buyers who would need a mortgage concede that they have not scoped out the current market or taken the steps needed to qualify.
Many potential buyers believe that they need near-perfect credit scores to get a home loan. Half of those surveyed said they had no idea what minimum FICO score is needed for a mortgage, and nearly a fifth (18%) said the minimum score might be 770 or higher.
Debt-to-income ratios are another insurmountable obstacle in many potential buyers’ eyes — enough so that they don’t even try to obtain a mortgage.
Most lenders use two forms of debt ratios: a “front end” ratio that compares the monthly costs of the proposed new mortgage and other housing expenses with the applicant’s monthly income, and a “back end” ratio comparing all recurring monthly debt obligations — housing expenses, student loans, credit cards and the like — with the applicant’s monthly income. Roughly a third of potential buyers on the sidelines believe that their debt ratios are too high.
But what’s the statistical reality on debt ratios, FICO score minimums and down payments? What are lenders approving?
The best answers come from a company called Ellie Mae, whose loan origination and tracking software is widely used by lenders. Every month Ellie Mae analyzes a huge sample of new mortgage originations nationwide and issues an overview report rich with the sort of detail that buyers sitting on the sidelines could use.
Here’s what it found in its report on March:
•Thirty-three percent of new loans last month had borrower FICO scores below 700. A year ago it was just 27%. (FICO scores max out at 850, which is considered excellent credit; applicants with scores under 700 present higher credit risks to lenders.) Federal Housing Administration-insured home purchase loans had an average FICO in March of 684. Conventional mortgages, those designed for purchase by investors Fannie Mae and Freddie Mac, still have relatively high FICOs — they averaged 755 in March, but that was down slightly from 759 a year before. Lenders are doing far fewer refinancings this year, so they are loosening up on FICO minimums for purchasers.
•Debt ratios also are more generous than many sidelined potential borrowers probably imagine. The FHA’s average front-end (housing costs) ratio last month for purchase loans was 28%. In other words, if your projected housing and mortgage-related costs represent 28% of monthly income, you’re average. Fannie Mae and Freddie Mac loans averaged 22% ratios on the front end. Back-end (total recurring debt) ratios for FHA averaged 41%. For Fannie and Freddie it was lower — 34%.
•Down payments can be small if that’s what you need. FHA’s average down payment last month for home purchases was 5%, but many borrowers put down just 3.5%. Fannie and Freddie allow 5% down as well, provided that you can pay mortgage insurance premiums. VA loans can go to zero down if your veterans status allows you to qualify. Department of Agriculture home buyer loans, which are designed for people who live in small towns, also allow for no down payments.
The point here: If you’re on the sidelines, check out what’s really going on in the mortgage market. There may be more opportunities — even in an era of tighter underwriting — than you think.
Article by Ken Harvey


